
Viz
A Viz turns a Table or saved result into an editable chart or headline number. Use it to compare categories, follow a trend or show a total, then place the saved Viz on a Page or download an image.
How a Viz works
A Viz reads fields from the Datasets you select. A Dataset is a Table or saved result; the chart's settings choose which fields to display. The Viz saves its selected sources, shapes, axes, labels and appearance without changing those source records.
Select an object in Viz Settings to edit its properties on the right. Add settings lets you build a chart from individual objects. Pie Chart and Donut Chart also have a working starter that creates their shapes and labels together. Other starter cards direct you to Add settings.
Prepare example data
Import a CSV called northstar-sales.csv with these rows. Check that Category is Text and Revenue and Quantity are Number fields.
The three rows total €4,000 revenue and 82 units. Bars can compare revenue by category; a Metric can show the total; a Donut can show the unit mix.
Category,Revenue,Quantity
Desk lamps,1200,30
Pendants,2250,30
Accessories,550,22
Create a Viz and select its data
Start with a saved Table or result containing the fields your chart needs.
- Open an Organizer folder's menu and choose Create → Viz.
- Select the root Viz in the Viz Settings tree.
- Under Datasets, choose Add Dataset and select northstar-sales.csv.
- Set Width and Height if you need a specific canvas, such as 580 by 380.
- Open Add settings. Choose the shapes, axes and labels you need, then select each new object to configure it.
- Rename the Viz in Organizer. Changes save automatically as you edit.
Example: show total revenue with a Metric
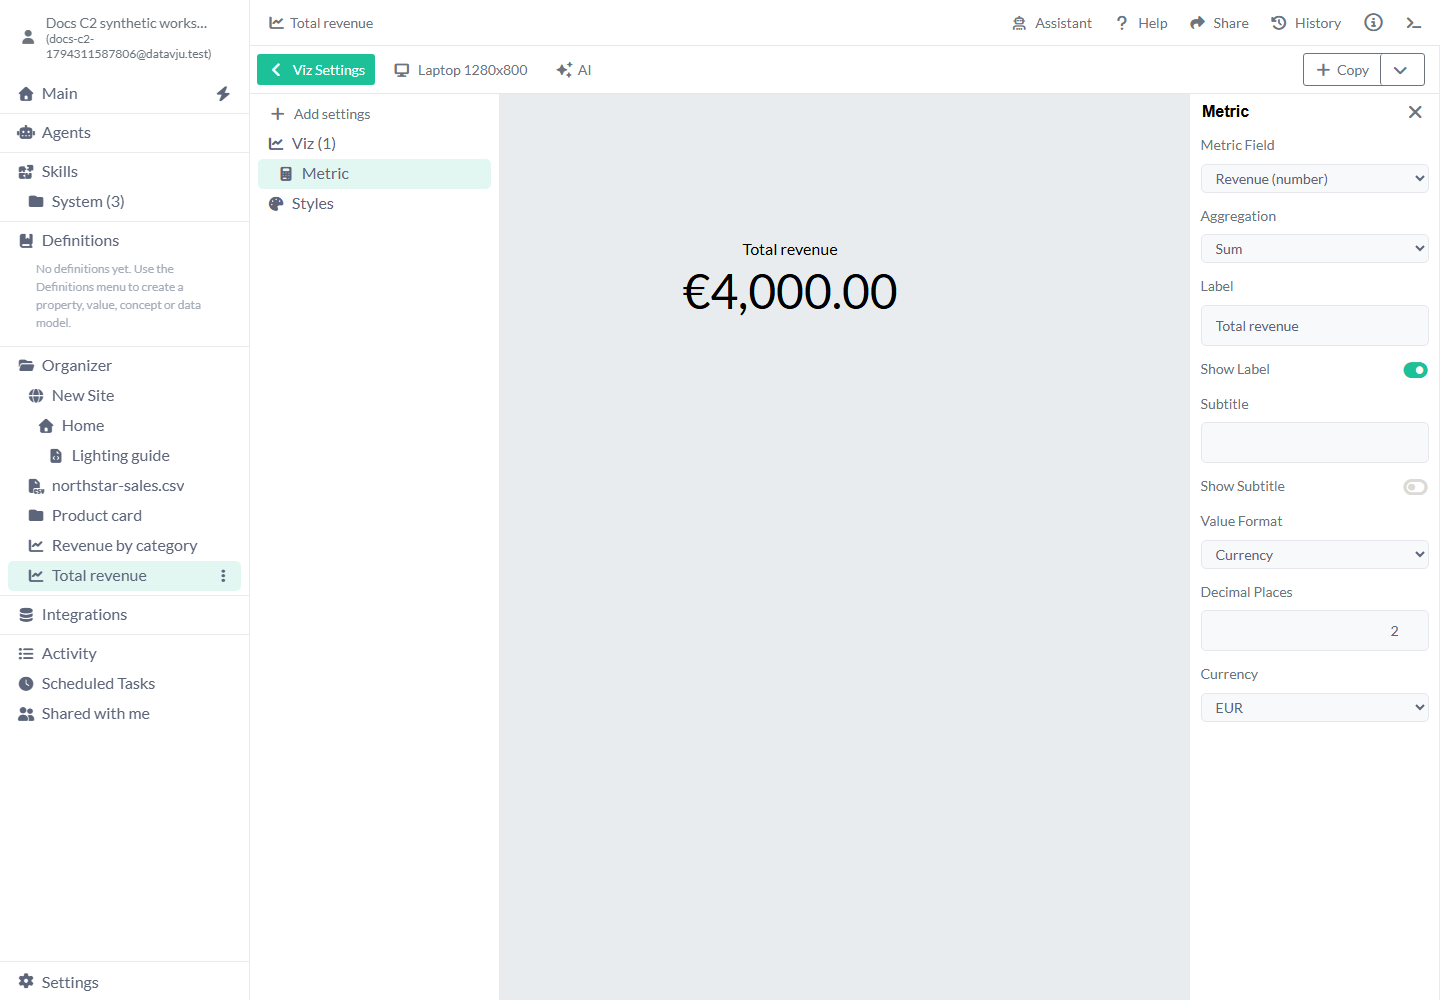
Metric starts with no field, Sum, label Metric shown, empty subtitle hidden, Number format and zero decimals. Average shows the arithmetic mean; Count counts non-empty values; Distinct Count counts different non-empty values. For these three Revenue values, Average is approximately 1333.33 and Count is 3. Use a numeric field for Sum or Average.
Show Label and Show Subtitle control the accompanying text. Currency offers EUR and USD; Percentage displays fractions as percentages, so 0.125 becomes 12.5% with one decimal. Decimal Places accepts whole numbers from 0 through 20. The Metric is centered. Use separate Vizzes on a Page for separate headline numbers.
- Create a Viz, select the root and add northstar-sales.csv under Datasets.
- Open Add settings, choose Shapes and add Metric. Select Metric in the tree.
- Set Metric Field to Revenue (number) and keep Aggregation as Sum.
- Change Label to Total revenue. Leave Show Label on.
- Choose Value Format → Currency, Decimal Places 2 and Currency EUR.
- Use a 580 by 300 canvas. Close the Settings Explorer and inspect €4,000.00 with the Total revenue label.
Example: compare revenue with Bars
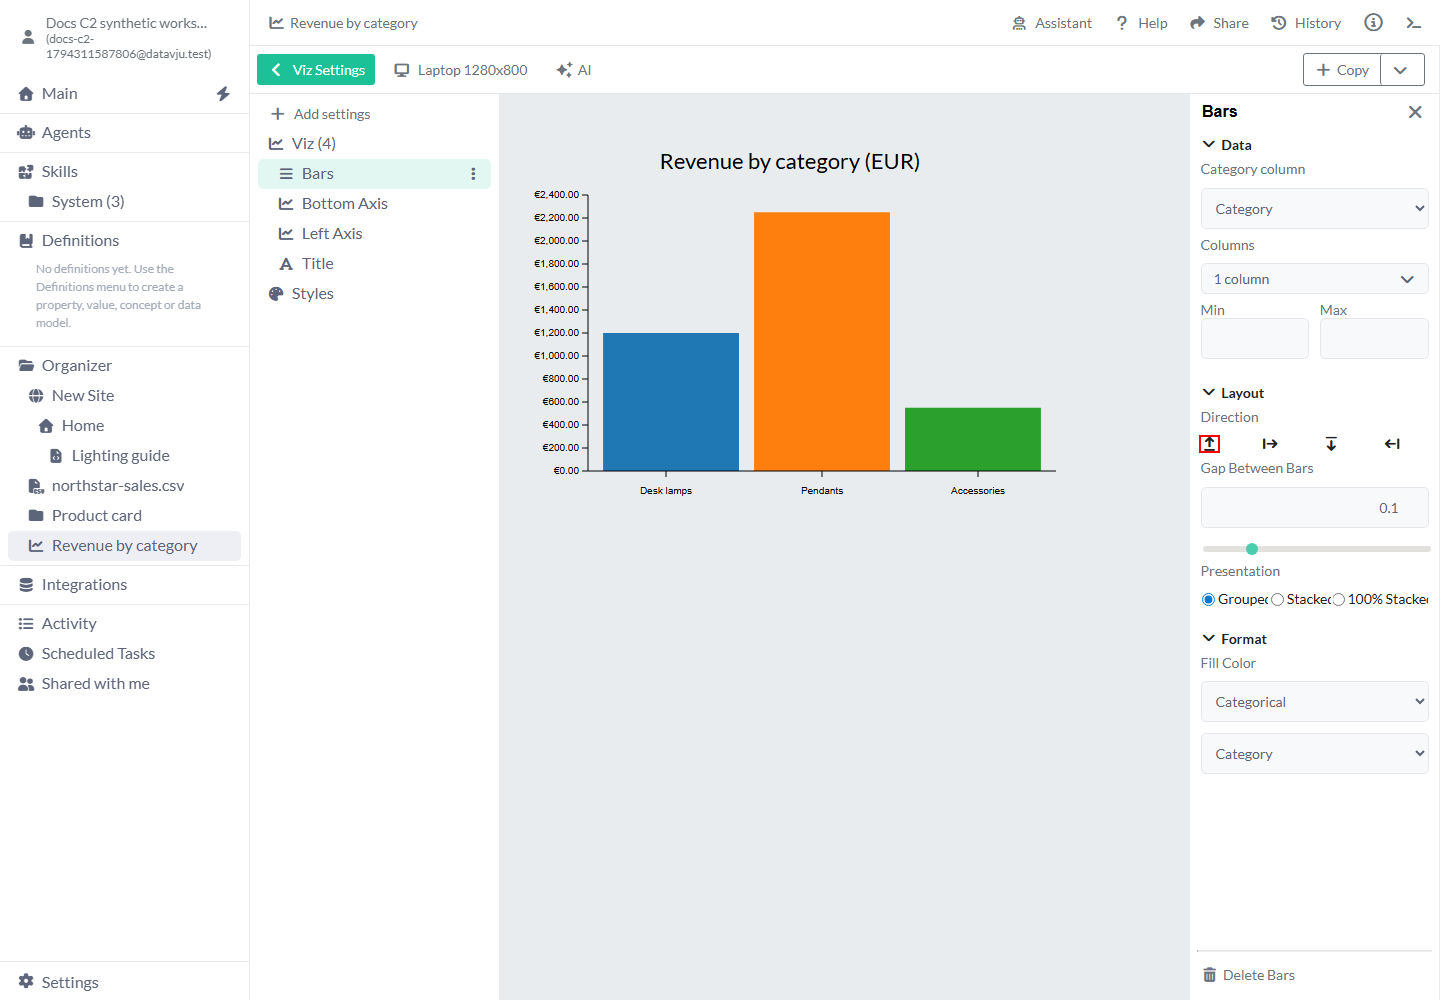
This configuration uses upward Bars with separate category and euro axes.
For horizontal bars, choose Direction Rightwards, use one numeric measure, put the category on Left Axis and the numeric measure on Bottom Axis. Configure independently added axes individually so their fields and bounds match the Bars.
- Create another Viz, bind northstar-sales.csv and set Width 580 and Height 380.
- Set the root margins to Top 48, Right 24, Bottom 56 and Left 88 to leave space for labels.
- Open Add settings → Shapes → Bars. Select Bars, set Category column to Category and choose Revenue in Columns. Keep Direction Upwards and Presentation Grouped.
- Select the root, add Bottom Axis and choose Category in its Columns.
- Select the root, add Left Axis and choose Revenue. Choose Value and set Min to 0; keep Max automatic.
- Open the Left Axis's Labels. In Number Format, choose Currency, EUR and two Decimal Places.
- Add Title and enter Revenue by category (EUR).
- Close the Settings Explorer. Desk lamps has a 1200 bar, Pendants 2250 and Accessories 550; the left labels show euros.
Bars settings
New Bars start Upwards and Grouped, with automatic numeric bounds.
Single-measure horizontal Bars accept positive, negative and zero values. Stacks require nonnegative data. Empty results show No data; invalid normalized values show Unavailable. A zero total has no percentage.
- Category column: starts unselected. Choose a Text field from the same Dataset as the numeric measures. Its row order supplies the categories.
- Columns: starts empty. Select numeric measures. A horizontal chart uses one; upward grouped/stacked charts support one to ten measures.
- Min and Max: automatic by default. Enter bounds to hold a comparison scale fixed. The minimum must be below the maximum; values outside the bounds are clipped. Clear both to restore the automatic zero-inclusive scale.
- Direction: Upwards by default. Rightwards makes horizontal bars.
- Gap Between Bars: starts at 0.1. Increase it for more space between categories.
- Gap Between Sub Bars: starts at 0.05 and appears for multiple Grouped measures. Change it to separate measures inside each category.
- Presentation: Grouped by default. Stacked adds nonnegative measures within each category. 100% Stacked compares their proportion and uses percentage axes and labels; it requires upward bars.
- Zero total label: appears for 100% Stacked and starts as No values. Change it to a phrase suited to your data.
- Fill Color: choose Color for a flat fill, Categorical for a palette, Diverging for a diverging palette, or Gradient for a gradient. Categorical colors follow measure order, or row order for one measure. Keep category order consistent when comparing separate charts.
- Value sign: available for one Rightwards measure. Set positive, negative and zero colors to distinguish gains and losses.
- Delete Bars: removes the selected Bars. Delete its axes or Title separately if you no longer need them.
Axes, ticks, grid lines and labels
Add Bottom Axis, Left Axis, Top Axis or Right Axis for the relevant side. Choose its Columns, Value or Index and scale settings. Value uses field values; Index uses row positions. Choose a time scale for Date values, a numeric scale for numbers and a category/band scale for categories. Keep chart and axis selections aligned.
Min and Max start automatic. Set them when a numeric comparison needs consistent bounds. Axes have Show Axis Line, Show Grid Lines, Show Ticks and Show Labels controls. Axis lines, ticks and labels start on; grid lines start off. Their color, width, opacity and placement settings adjust the visible guides. Horizontal single-measure Bars can use Grid line placement → Zero only for a zero guide.
Labels offers Number Format, Decimal Places, Currency, font, size, rotation and horizontal/vertical position. Number, Currency and Percentage change the text formatting rather than the source values. Leave an unspecified format to use the current scale's formatting; choose Number and zero decimals for whole counts. Currency supports EUR and USD. Precision is a whole number from 0 through 20.
Add Bar Labels or Line Labels when the values should be printed beside shapes. Choose their chart and fields, then set placement and typography. Bar Labels offers Number Format and Decimal Places too. Add an Axis Label for an axis title; choose its axis, enable Show Axis Label and enter the text.
Example: show the unit mix with a Donut
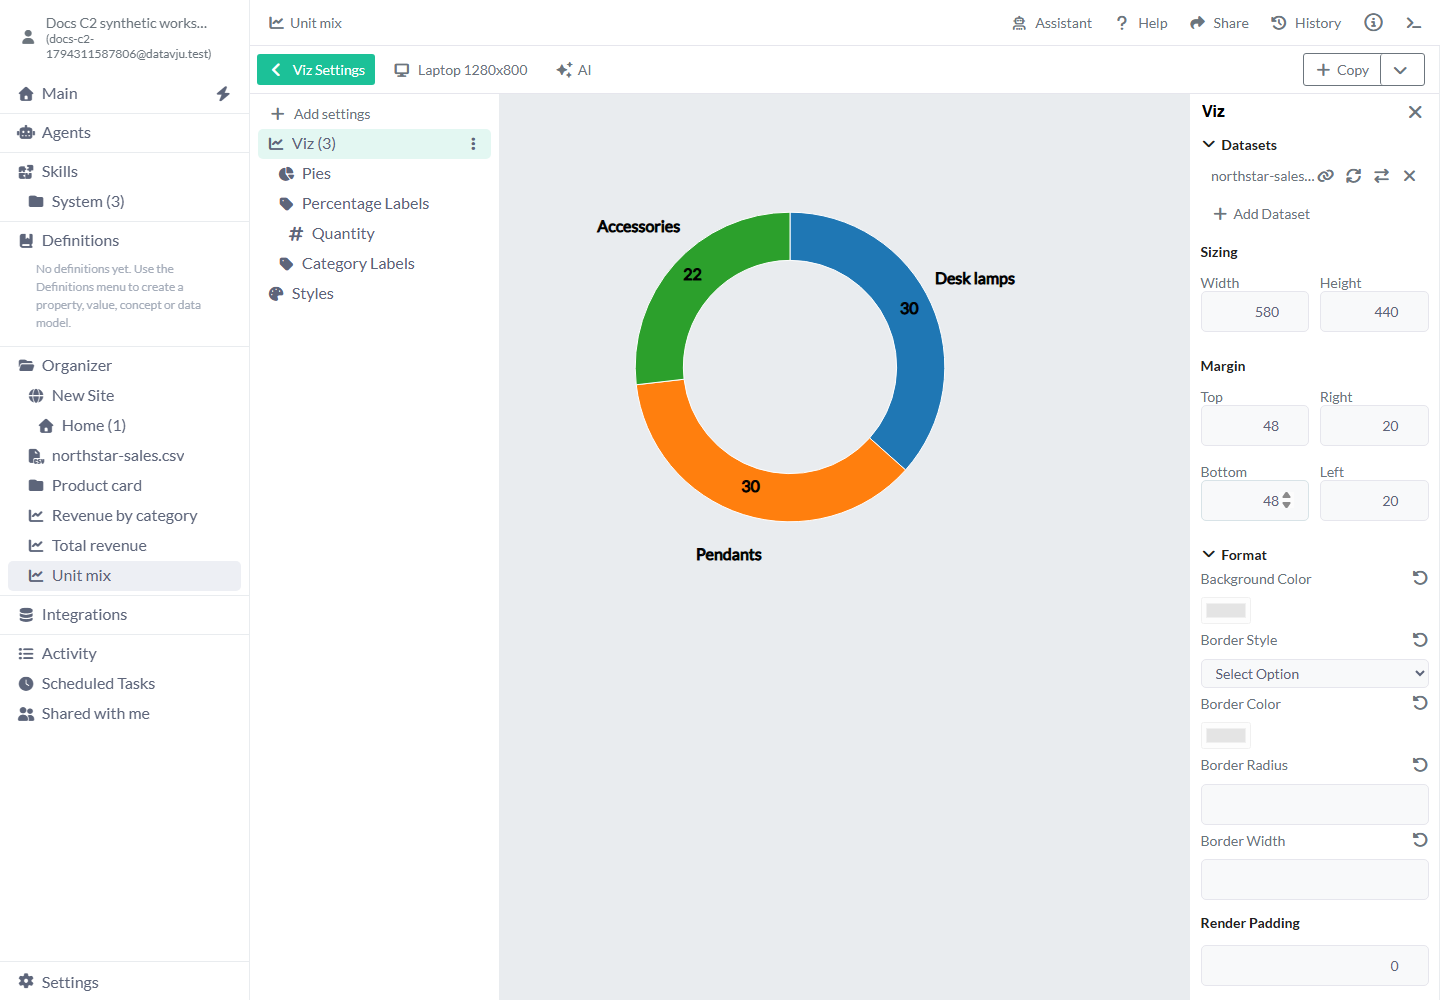
The two 30-unit categories occupy equal angles; Accessories occupies a smaller angle for its 22 units. The current starter percentage labels format raw counts as percentages, so 30 appears as 3,000%; automatic percent-of-total labels are not available yet. Choose Number for counts, or supply a fractional share field when you need percentage text. The chart's segment angles use the selected angle values.
- Create a Viz, bind northstar-sales.csv and set a 580 by 440 canvas. Set Top and Bottom margins to 48 so the category labels fit inside it.
- Choose Donut Chart, then Next.
- Set Angle field to Quantity and Category labels to Category.
- Keep Inner radius at 0.62. Clear Include centre composition for a simple chart, then choose Use Settings.
- Expand the Viz tree, then Percentage Labels. Select its Quantity field.
- Set Label format to Number and Decimal places to 0. The labels show 30, 30 and 22 beside the three category segments.
Pie and Donut settings
Select Pies or its label objects to adjust the ring, composition and label presentation.
- Angle field: initially unselected. Choose one numeric field. Category labels is optional and initially off; choose a Text field from the same Dataset.
- Inner radius: Donut starts at 0.62, Pie at 0. The starter accepts 0 to less than 0.9 and uses outer radius 0.9. Pies added individually start at inner 0 and outer 1.
- Include centre composition: on for Donut. Clear it for a simple open centre. The Pies properties let you edit the Centre disc, Outer ring and Centre figures separately.
- Centre disc: white, radius 0.58 with Soft shadow on when enabled. Shadow blur starts at 6, opacity 0.25 and offset 3. Adjust these for the intended depth.
- Outer ring: color #b8bec5 and width 6 when enabled. Change the color or width to fit your presentation.
- Centre figures: starts with person and dress icons, colors #008f99 and #df4475, height 70 and gap 16. Choose each figure and color, then adjust height and gap.
- Pies alignment: centered horizontally and vertically. Inner Radius and Outer Radius change the ring's size; Corner Radius, Pad Angle and Pad Radius start at 0 and round or separate segments.
- Fill Color: a series fill applies to all segments. Gradient supports 2–32 stops, each with offset, color and opacity from 0 to 1. Add Color Stop, finish with Done, and remove a stop before adding at the limit.
- Customize segment fill: expand Pies and its numeric field, then select a row to override its fill. Use series fill removes that override. Segment opacity uses a percentage. Overrides follow row positions; recheck them after sorting or filtering.
- Pie Labels: choose Label Column, Label format and Decimal places for each selected field. Source value uses the source text; Number and Percentage format its values. Percentage formats fractions as percentages. Precision is 0–20. Change the label's radius, position, font and size to avoid overlap.
Lines, Areas and Points
Lines connects one or more numeric series over row positions or a selected numeric/Date horizontal field. In Horizontal Data, choose Value and the horizontal column for meaningful spacing; choose the time scale for dates. Series starts empty and horizontal data starts at row Index. Missing observations leave gaps. Line Points offers Show Observation Markers and Size; observed zero remains visible. Expand a series and edit Series display name to use a readable legend name while keeping its field selection.
Areas uses similar horizontal and series settings. Stacking starts at Overlapping. Choose Stacked for nonnegative counts or 100% Stacked for proportions. A missing observation leaves a gap across the stack; a zero total has no percentage. Associate a Legend with the Area to identify its measures.
Points and Scatter Plots display paired values. Select their horizontal and vertical fields before expecting marks. Size starts at 3. In Scatter Plot properties, No Column clears an axis and Select Color Column clears a color binding. With no color column, the points use a single color. Re-select a field to reconnect it.
Maps and geographic marks
Add Map through Add settings. Map Category starts unselected: choose Continent, Country or Regions, then choose the Map. Projection starts at Mercator; choose another offered projection when it better suits the area you are showing. Scale and Translate position the fitted map inside the canvas; use their reset controls to return to the fitted values.
Center starts at longitude 0 and latitude 0. Longtitude is the longitude control's current label; its range is −180 to 180. Latitude ranges from −90 to 90. Rotation X, Y and Z start at 0 and range from −180 to 180. Change center or rotation to bring the desired area into view. Fill Color, Stroke Color and Line Width are initially unset; add them to distinguish land and boundaries. Delete Map removes the selected map.
Add Map Points to draw data locations. Select the Map, Latitude Column and Longitude Column. Choose Point Symbol, then Size. The symbol choices are Circle, Cross, Filled Cross, Location Dot, People, Person and Square. Stroke Width, Stroke Linecap and Stroke Style appear for symbols that use an outline. Use its opacity and outline controls to adjust the visible marks. Check a known coordinate before adding the full Dataset.
Map Component Points places a reusable Component at geographic coordinates. Select its Map, data and coordinate columns, then choose Point Component and its available Component Properties. Use this when a location needs a custom card or symbol built in Story rather than a simple point.
Scatter Plot settings
Select Horizontal (X) Variable and Vertical (Y) Variable; both start unselected. Choose fields containing the two measurements you want to compare. A field's Scale Type offers UTC, Band, Linear, Logarithmic, Sqrt and Time. Use Linear for ordinary numbers, time/UTC for dates and Band for categories. Logarithmic requires suitable positive values; inspect the source's range first.
Plot Shape starts at Circle and also offers Square. Size starts at 3. Use Fill Color for the marks, or select a color column for data-driven colors. No Column clears an axis selection; Select Color Column clears the color column. Other settings stay in place so you can select another field.
Display a correlation matrix
Correlogram displays an existing matrix, such as the saved result of Correlation. Select that matrix Dataset and its variable-name column in Variables Column. Each row must name a variable and contain the numeric matrix values under the matching variable columns. Run Correlation first when your source contains observations rather than a matrix.
Variables Column starts unselected. Margin starts at 0 on all sides. Diagonal Direction starts down-right; change it to reverse the displayed diagonal. Choose Coloring Method → Color Scheme, then Type of Scheme: Single-Hue, Multi-Hue, Diverging or Cyclical, and the Color Scheme itself. Color (Add Manually) uses the fixed red, white and navy palette. Select the method explicitly when first configuring the chart.
Left Side and Right Side start on, with Square cells and Show Labels on. Turn off a side to display one triangle, or choose No shape, Circle or Square. The off-diagonal labels show matrix values to two decimals. Diagonal starts with Show Diagonal on and Square selected; hide it to emphasize comparisons between different variables, or choose No shape or Circle.
Right Side → Circle exposes Edit Circle. Circle Sizing lists Fixed Sizing, Relative to Cell and Relative to Value; new circles use Fixed Sizing with Radius 10. Editing the circle sizing controls isn't available yet.
Titles, Legends and SVG
Title starts empty. Enter the text, then choose Dynamic or Fixed position, margins, horizontal/vertical alignment, color and typography. Dynamic positions the element within the canvas layout; Fixed uses its entered position. Subtitle is a separate text object.
Legend starts vertical and centered, with names shown, shape and background off. Choose its chart or data source, horizontal/vertical orientation, position and names. Enable the shape for a symbol and Background for a padded panel. Names can use the source format or Number, Currency or Percentage. Use the same legend order as the chart's selected fields.
SVG starts with Source Icon, no chosen icon, size 48 by 64, centered position, zero x/y offsets and color #1342cd. Select an Icon, or choose SVG content, paste a vector SVG with a viewBox and choose Apply SVG content. Aligned position follows the inner canvas; Fixed starts from its top-left. Width and Height must be positive and the source keeps its aspect ratio.
Use vector shapes and groups for pasted SVG. Scripts, styles, images, text, embedded HTML and references are refused. An invalid input shows an error and stays unsaved. Changing Source clears the inactive source's content.
Canvas, data and shared styles
The root Viz starts responsive, with Width and Height unset and margins of 20 on each side. Entering dimensions fixes the canvas size; leave room for labels and legends. The surrounding Page controls its own space and overflow. Background Color and Border controls start empty; choose a border style, color, width and radius when needed. Render Padding adds room for output edges.
Datasets lists the selected sources. Add Dataset connects another permitted source. Refresh beside a saved View reruns that View; confirm the refresh. Refresh All Datasets rereads the selected sources. A source-field error keeps the previous saved result: correct the source or its settings and refresh again.
Styles supplies reusable appearance settings for Axis Lines, Grid Lines, Labels, Pies and Ticks. Line styles start with #1342cd and width 1; Labels starts with that fill. Override the selected object's color, font, width or opacity when it needs a different presentation. These are Viz appearance controls; Page Styles belong to Story.
Reuse, download and save
Insert Viz on a Page and use Select Viz to choose it. The interactive Page uses the saved chart; regenerate Prerender or publish again after presentation or source changes to update generated HTML.
Open Copy and choose Download PNG or Download WebP for an image. Download Model retains editable chart settings and included data. Import it through Organizer → File Upload → Model when you need an independent editable copy.
AI opens supported edit assistance for the selected Viz; Assistant can explain its saved settings. Use them for supported edits after the source data is selected, then inspect the saved result. Changes from another open editor can appear automatically. If a revision conflict is reported, reopen the Viz to load the saved version and reapply your intended edit.
Limits and common mistakes
Field types, axis selections and canvas space affect the chart you see.
- Choose fields from the intended Dataset and check their types. Sum and Average need numeric values; a numeric-looking Text field needs correction in the source.
- Add and configure axes for manually added shapes. A separate axis needs matching fields and bounds.
- Sort or aggregate in the Dataset when you need a ranked or grouped result. Drawing Bars keeps the source row order.
- Choose Number labels for raw Donut counts. Check label values separately from the segment angles.
- Leave room for labels inside the canvas and inspect its Page layout at smaller widths.
- Check empty results and zero totals. A Metric's em dash means no rows or no non-empty values for its aggregation; field-selection messages identify an incomplete Metric.
- Recompile or republish generated Page output after changing chart settings or source results.