
Group
Group summarizes a Dataset into one row per combination of grouping values. Use it for totals by region, counts by status, or lists of products nested inside each category. You choose which fields identify a group and which calculations describe the records in it.
How Group works
Each item defines one output column. Choose Function → Group for a field that identifies the groups, or a calculation such as Sum or Count for a figure within each group. Group keeps these settings as an Organizer item, and the original source records remain available.
Save creates a separate View that you can refresh using its saved steps. Save as Table creates editable rows. Use Pivot when values such as April and May should become separate output columns. Use Transform's Partition Aggregate when you want to keep each detail row beside a figure calculated for its group.
Build a grouped summary
Create one grouping item for region and one calculation item for the units total.
Use the item's edit icon to reopen its settings. Return from Edit Column to the item list to reorder items with their drag handles. Changing the column name and immediately saving retains that name.
- Open the source Dataset, open the arrow beside New, then choose Group.
- Choose Add group. A new item starts with Function → Group.
- Select Group Column, such as
region. Check Column Name, which names that item in the output. - Choose Add group again. Set Function → Sum, Group Column → units and Column Name → Total units.
- Check that the preview contains one row per region and the expected totals.
- Choose Save to create a View. Inspect its complete result and retain the original Group if you want to change its configuration later.
Functions
The Function menu shows the available calculations. Group Column offers the source fields compatible with the function you select.
Three order rows containing quantities 8, 3 and 4 give Count 3 and Sum 15. Unique calculations remove repeated values; use complete record keys when identifying duplicate business records.
- Group - What it calculates: One result group for each distinct value, combined with other Group items. Example:
regionandmonthgive one row per region/month pair. - Count - What it calculates: Number of non-null values in the selected field; all counts rows, including those with null fields. Example: Count non-null
sku, or count all orders. - Count Unique - What it calculates: Number of distinct non-null values. Example: Count different SKUs sold per region.
- Average - What it calculates: Mean of the selected compatible values. Example: Average unit quantity.
- Average Unique - What it calculates: Mean after removing duplicate values. Example: Values 2, 2, 8 average to 5 when unique, versus 4 normally.
- Max, Min - What it calculates: Highest or lowest compatible value. Example: Latest Date, or minimum numeric price.
- Sum - What it calculates: Total of compatible values. Example: Sum units per region.
- Sum Unique - What it calculates: Sum of distinct values. Example: Values 2, 2, 8 total 10. Use a record key when you need to identify duplicate records.
- Median - What it calculates: Middle numeric value, averaging the middle pair for an even count. Example: Median order quantity.
- Std Dev (Sample) - What it calculates: Sample standard deviation of compatible numeric values. Example: Compare variation in quantities between regions.
- Sum of Count - What it calculates: Total count across groups, repeated beside each group. With Rollup, totals follow the subtotal level. Example: Show 6 beside each region in a six-order source.
- Sum of Count Unique - What it calculates: Distinct count across the input. Example: A SKU sold in two regions counts once in the overall distinct total.
- Sum of Sum - What it calculates: Total of group sums, repeated beside each group. With Rollup, totals follow the subtotal level. Example: Regional sums 15 and 13 carry an overall total of 28.
- Aggregate to Array - What it calculates: Retains selected input values as a list inside each grouped row. Example: Keep a list of products per category.
Settings and filters
Each item keeps its own calculation settings. The result also has separate Filter and Sort controls.
Item settings
Group Column selects the input field. A new item chooses the first compatible field not already used, when one is available; check that choice before continuing. Column Name starts from a generated label. Change it to a clear output name such as Total units.
Count, Average, Sum, Median, Std Dev and their unique/total variants offer a calculation Filter. It starts empty and selects which source records contribute to that calculation. For example, calculate Open units and Approved units in separate columns of the same summary.
The result's Filter selects the groups you keep after calculation. Use it to keep regions whose Total units exceeds 10.
Filter rules use the field's comparison options and values. Combine conditions with And when every comparison must hold, or Or when either is sufficient. Leave filters empty to include the available input/result without extra restrictions.
The result's Sort starts without an explicit order. Add Total units descending to put the largest region first. From Row and To Row start empty and can restrict the result range. Check the complete saved result when you need every group.
Delete Group Column removes this output item from the Group. The source fields remain available.
Nested arrays
For Aggregate to Array, use Columns to choose the input fields to keep in each list. The selection starts empty. Array Type starts as Objects, which keeps named fields, such as [{"sku":"LAMP-01","units":8}]. Repeated objects remain in the list.
Choose Values to keep the selected values. Switching to Values turns Unique Values on; turn it off when repeated values should remain. For SKU values LAMP-01, CHAIR-02 and CHAIR-02, Unique Values gives a two-value list. Turn it off to retain all three. Switching back to Objects clears this Values-only setting.
When the source has a primary key, Columns → Primary Key can include it in Objects. Keep it when a control displaying the nested records must identify each original source row.
Sort nested arrays
The item's Sort controls order inside the list. It starts with No order specified. Choose input fields and directions in priority order. Add a further field when equal values need a consistent order. Use the result's separate Sort to order the group rows.
With Unique Values and one selected field, sort by that same field. To sort a list containing several selected fields, turn Unique Values off. A deleted source field stays visible as unavailable so you can choose its replacement.
Rollup
Rollup starts off for grouping fields. Turn it on when you need subtotal rows. For region sums of North 15 and South 13, rolling up region adds a total row of 28 with an empty region value.
Show Grouping Column starts off. Enable it with Rollup to identify the subtotal rows. With region as the only grouping field, Grouping is 0 for North and South and 1 for the total row. This helps you distinguish the total from records that genuinely have an empty region.
Save and AI
Save and Save as View create a new View. Open the arrow beside Save for Save as View to..., which selects its Folder, or Save as Table, which creates editable rows. Add at least one Group item to enable Save. Saving uses the full source with the saved settings; check the output's complete row count.
AI edits this Group, including from an empty configuration. For example, ask “Group by region and sum units as Total units.” Answer a clarification in the same window. Assistant can explain the saved Group or carry out a requested edit under the current permissions. Check the resulting items and preview after either operation.
Replace, transfer and Agents
Use Replace in Group's Save menu to rebuild an existing View while retaining that View's identity. Select the intended target and confirm its resulting rows. To change the source of the Group itself, open the replacement source's output menu, choose Replace, then select the Group. The Group retains its settings, reconciles them with the new source and updates its open tab; the original sources stay unchanged.
The Save menu can also start a Group, Join or Transform from the grouped output. Their location arrows choose the destination. Download Model and Create Model Snapshot copy the saved settings with their required inputs; keep all required source content in the included Folder when you need an editable copy elsewhere.
Agents and external AI tools connected through MCP can configure Group and save outputs when they have access to the source, Group and destination. Check the saved result as well as any sample they inspect. Deleting a Group keeps a source Dataset that you saved separately. Read any dependency message before deleting an item.
Examples
Use six orders with unit quantities North 8, 3 and 4, and South 5, 2 and 6 for the regional total.
Total units by region
Add Group(region) and Sum(units), naming the calculation Total units. The two results are listed below.
Add Count(all) if you also need the number of orders: each region has three rows. Apply Sort when their display order matters.
- North - 15
- South - 13
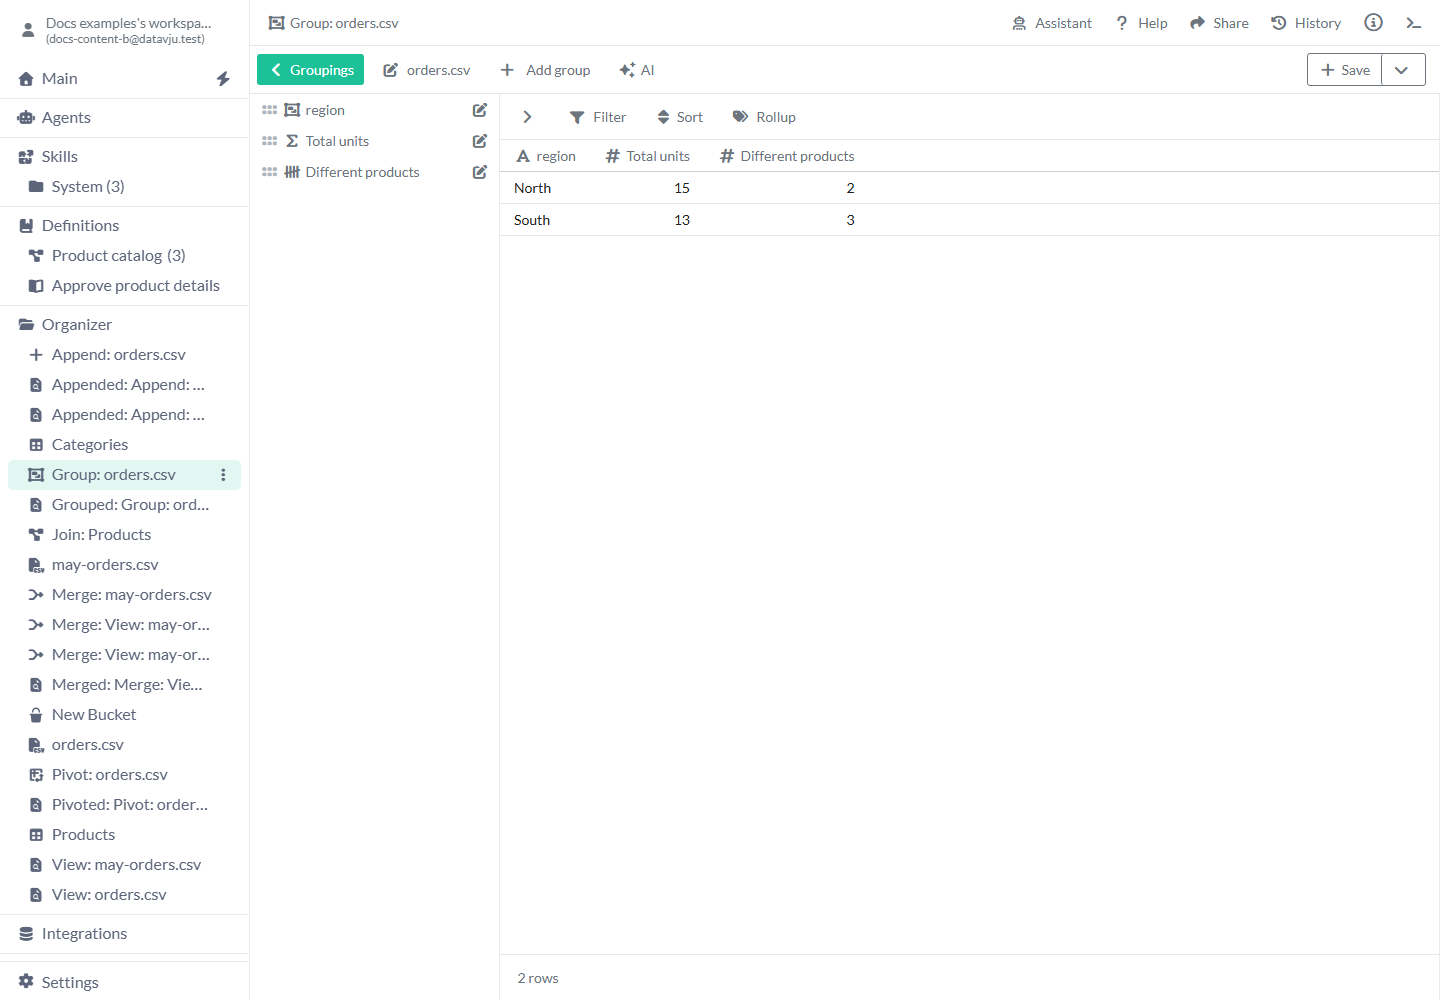
Sum units and Count Unique products answer different questions.
Count SKUs without counting repeat sales
North contains LAMP-01, CHAIR-02, CHAIR-02. Group by region and apply Count Unique to sku. North returns 2 distinct products. Count(sku) returns 3 non-null occurrences instead. Use the first for assortment breadth and the second for populated order lines.
Keep product details in a category
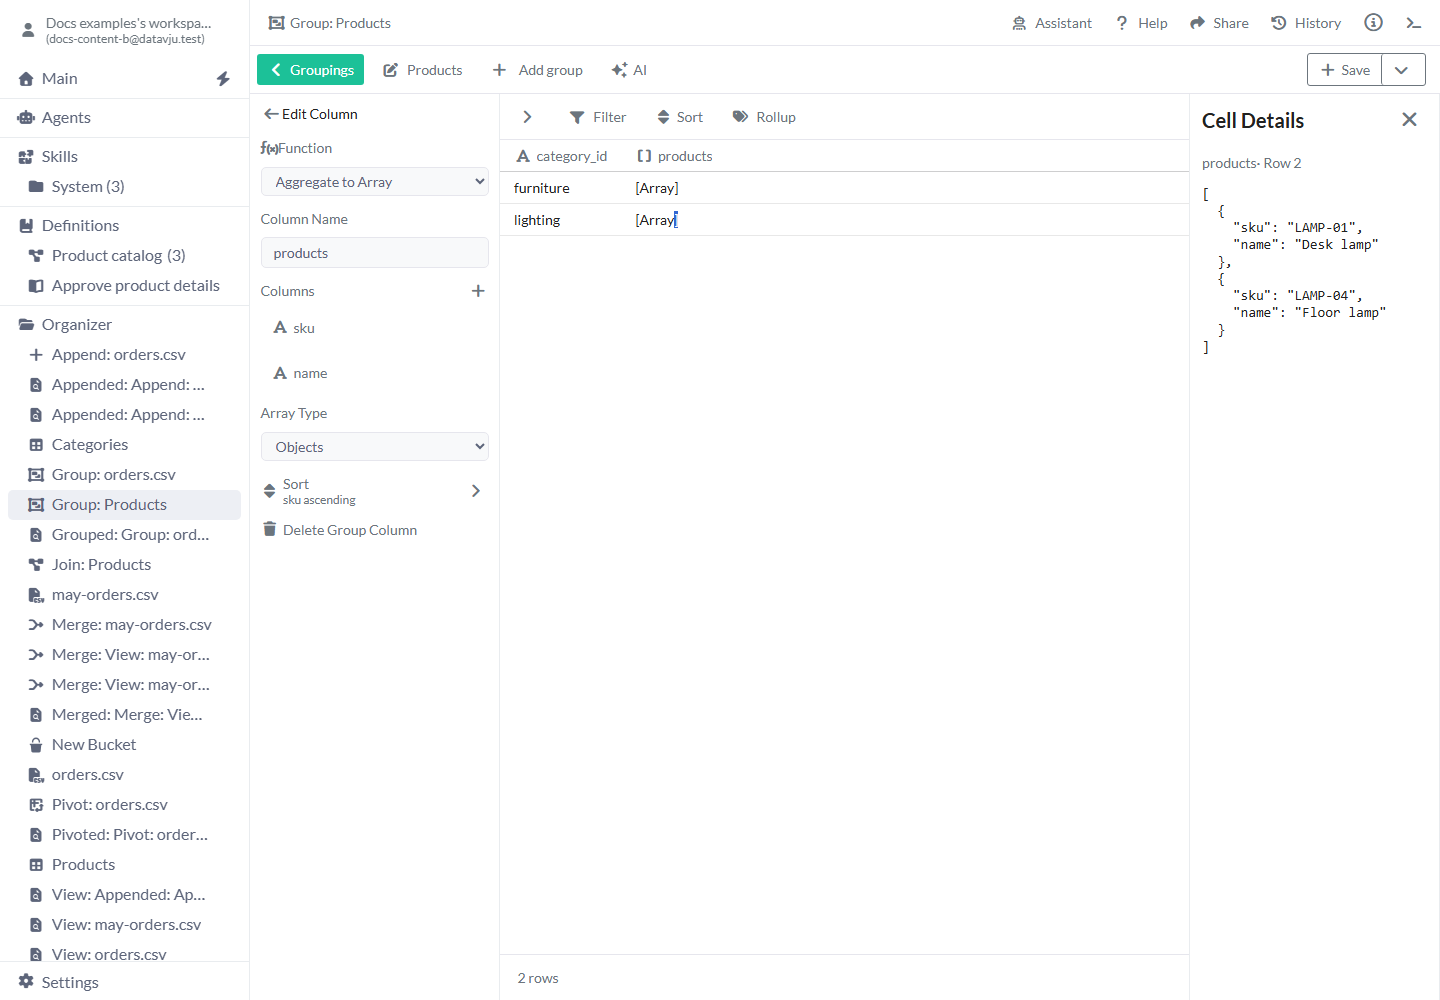
Products contains category_id=lighting for LAMP-01/Desk lamp and LAMP-04/Floor lamp, and category_id=furniture for CHAIR-02/Office chair. Add Group(category_id), then Aggregate to Array with Objects containing sku and name, named products. The lighting result contains the product list shown below.
Set the array's Sort to sku ascending to put LAMP-01 before LAMP-04 in that list.
{
  "category_id": "lighting",
  "products": [
    {"sku": "LAMP-01", "name": "Desk lamp"},
    {"sku": "LAMP-04", "name": "Floor lamp"}
  ]
}
Sort the nested list itself when product order matters.
Limits and common mistakes
Each combination of Group fields produces a separate result row. Adding sku to a region summary changes it to one row per region/SKU pair.
- An aggregate filter selects contributing input rows; an output filter selects resulting groups.
- Unique calculations operate on values. Use an explicit record key and preparation when you intend to deduplicate records.
- Native Date, DateTime and DateTime TZ support grouping, counts, Min and Max. Native Money supports grouping, counts and compatible-currency sums; Duration supports grouping and counts, while Duration Min remains unsupported. Money Sum requires compatible currencies. Unsupported type/function combinations refuse rather than discarding their meaning.
- Arrays have no guaranteed order until you set their own Sort, and equal sort keys still need a tie-breaker if order matters.
- Editing a Group does not directly rewrite an already saved View. Save a new result or replace the intended existing output; that View's Refresh replays its own saved layers.
- Group inspected through a View's Layers is read-only. Edit the actual Group item to change it.