
Pivot
Pivot summarizes your data with fields arranged in rows and columns. Use it to compare sales by region and month, count records by status or show several calculations together. For example, April and May can become columns showing each region's total units.
How Pivot works
Put fields such as region and month in Rows and Columns to divide the data into groups. These grouping fields are often called dimensions. Put a calculation such as Count or Sum in Values; each calculation is called a measure.
Pivot uses the source Dataset's current filters and search. It keeps your field and calculation choices in an editable Organizer item. Saving creates a separate View using the choices made at that time.
Use Group for a flat summary with one row per group. Use Pivot when separate columns for months or categories make comparison easier. Both keep the original source records available.
Build a Pivot
For a regional sales report, put regions in Rows, months in Columns and units in Values.
Drag field handles to reorder fields or move them between the field areas. Their order sets the hierarchy: region then product differs from product then region. Remove a field with its remove control when it should no longer participate.
- Open the source Dataset, open the arrow beside New, then choose Pivot.
- Use the add control beside Rows to select a field, such as
region. - Add a field under Columns, such as
month. - Add
unitsunder Values. A newly added value field starts with Count, even when it contains numbers. - Select that value item. Set Summarize by → Sum and Measure name → Units sold.
- Check the preview, including Grand Total. Select row or column fields to adjust their order and totals.
- Choose Save. The new View opens separately; keep the Pivot item for future configuration changes.
Rows, columns and filtering
The order of your selected fields determines which groups appear together. Choose the layout before interpreting totals.
Rows and Columns
New dimension fields start with Order → Ascending and Show totals on. Change Order to Descending when readers need the reverse label order. Show totals adds the corresponding subtotal or total; turn it off where another total would be redundant.
With multiple row dimensions, Repeat row labels controls whether a parent label repeats beside its child rows. It starts off. Repeating Region on each product line can make an exported report easier to read.
Choose a layout
Grouped starts on. Its row control appears when you select more than one Rows field; the column control appears with more than one Columns field. Turning row Grouped off enables Wide and Narrow, with Narrow selected initially.
Compact view starts off and appears with multiple Rows fields. Enable it to combine their displayed labels into one Row Labels column. Wide can show North-April; Narrow can show month-April. The calculations stay those of the chosen layout.
With multiple Columns fields, Grouped keeps their combined column hierarchy. Turning it off shows the fields' separate summaries across the output. Check the resulting headers and totals when changing either axis.
- Rows Grouped on - What you get: A hierarchy of combinations in the selected field order. Region and month example: North totals 15, with April 11 and May 4 beneath it. South totals 13. Grand Total is 28.
- Rows Grouped off, Wide - What you get: Separate field columns for the combinations and their subtotals. Region and month example: North/April is 11 and North/May is 4. Grand Total stays 28.
- Rows Grouped off, Narrow - What you get: A separate summary for each selected field, under Field Name and Field Value. Region and month example: Month gives April 16 and May 12; region gives North 15 and South 13. Each input contributes to both summaries, so Grand Total is 56.
Filter the source
Prepare the source Dataset's Filter and search before creating Pivot. For example, keep only Approved orders in a source View, then build Pivot from that View. Use that source to change which records contribute; the Pivot screen has Rows, Columns and Values areas. Save a new result after changing the input or calculation choices.
Measures
Select a Values item made from a source field, such as units, to open these settings. Count of All and statistics have their own controls described below.
- Measure name - Initial state: A generated name such as Count of units. Meaning and example: Exact output label. Enter
Units sold; later aggregation changes retain an explicitly entered name. - Summarize by - Initial state: Count for a newly selected value field. Meaning and example: Choose the calculation. For quantities 8, 3, 4, Count gives 3 while Sum gives 15.
- Show as - Initial state: Default. Meaning and example: Show the aggregate itself, or express it relative to a row, column or the whole Pivot.
- Measure format - Initial state: No formatting. Meaning and example: Select Number, Percentage or Currency for display. The result remains numeric.
- Currency - Initial state: Appears after choosing Currency; starts at USD. Choices are EUR, GBP, JPY and USD. Meaning and example: Select the currency label for this measure. Formatting a Number keeps its numeric value; use actual converted amounts when comparing currencies.
- Decimal controls - Initial state: Number, Percentage and Currency start at two decimal places; the arrow controls allow 0–20. Meaning and example: Increase or decrease displayed precision. For example, show 73.33% rather than a long decimal.
Choose a calculation
Summarize by starts at Count. Choose the calculation that answers your question.
The Values add menu also has Count, which creates Count of All without a source field. Select that item to use its Show as control. Choose a Number field for calculations such as Sum or Average; use category labels for grouping or counting.
- Count counts non-null values of the selected field.
- Count of All counts source rows at that intersection, regardless of a selected field's nulls.
- Sum adds compatible numeric values.
- Max and Min choose the largest or smallest compatible value.
- Average calculates their mean.
Add a statistical function
Open the add menu beside Values and choose Add Function to open Select Function. Its category starts at Basic Aggregations. Choose Descriptive Statistics, then your function. Select the newly added item in Values to open its settings, then select the numeric field to calculate. The field choices start empty.
Choose a numeric field when a statistic shows an empty result. After you reopen Standard Deviation or Variance, Sample can appear unchecked even when its calculation is active; choose Population or Sample again to confirm the intended calculation.
Use Population when your records are the complete set you want to describe. Use Sample when they represent a sample of a larger set.
- Correlation - Settings and use: Select numeric Variable 1 and Variable 2, initially unselected. It measures their linear association. Example: Compare units and numeric price across source rows.
- Mean - Settings and use: The arithmetic average. Choose Select Mean Column; Show as starts at Default. Example: Units 8, 3, 4 have mean 5.
- Median - Settings and use: The middle value in sorted order. Choose Select Median Column. Example: Quantities 3, 4, 8 have median 4.
- Mode - Settings and use: The most frequent value. Choose Select Mode Column. Example: Quantities 2, 2, 8 have mode 2.
- Range - Settings and use: The difference between the largest and smallest values. Choose Select Range Column. Example: Quantities 3, 8 have range 5.
- Standard Deviation - Settings and use: Spread in the original value's units. Choose a numeric field from the picker currently labelled Select Variance Column, then Population or Sample. Population is the default. Example: Values 3 and 4 have Population deviation 0.5, or Sample deviation about 0.7071.
- Variance - Settings and use: Squared spread around the mean. Choose Select Variance Column, then Population or Sample; Population is the default. Example: Values 3 and 4 have Population variance 0.25, or Sample variance 0.5.
- Frequency Distribution - Settings and use: This calculation is not available yet. Example: Use Group with Count for a category-frequency summary.
Show as percentages
Choose whether each cell should show its calculated amount or its share of a row, column or overall total.
For a source-backed measure, choose Percentage under Measure format to display a percent symbol and set decimal places. Choose the denominator with Show as first.
Show values as rows starts off and appears when there is more than one Values item. Enable it to put measures such as Units and Order count below each other instead of beside each other.
- Default - Denominator: None; shows the aggregate. Example: North/April units are 11.
- % of Row - Denominator: That row's total. Example: North totals 15 units; April is 11/15 = 73.33%.
- % of Column - Denominator: That column's total. Example: April totals 16 units; North is 11/16 = 68.75%.
- % of Grand Total - Denominator: The whole Pivot total. Example: Total is 28 units; North/April is 11/28 = 39.29%.
Empty and missing values
Show Value in Empty Cells starts off. Enable it to reveal Value for Empty Cells, initially blank. A numeric value such as 0 can replace empty source values during calculation and change Average, Count or a statistic. Use it only when that replacement matches what the empty value means. Use a numeric replacement for a numeric measure.
Filling missing values using mean, median or regression under More Settings for Empty Cells is not available yet.
Show Missing Field Values starts off. Enable it to include absent combinations of the selected fields' values. For example, with regions North and South and four SKUs, it can show all eight region/SKU pairs, including pairs with no source record. It also works with ungrouped layouts; the hint saying otherwise is out of date. Those added pairs can have empty calculation cells, while the source records stay unchanged.
Save and refresh
Save and Save as View create a new View every time. Names start with Pivoted: <name> and receive a numbered suffix when necessary. Save as View to... lets you select another Folder; cancelling its picker creates nothing.
The saved View keeps its own Pivot settings. Use its Refresh to recalculate them from the source. Save a new View when you want to use edits made to the Pivot, such as different fields, totals or formats.
CSV downloaded from the saved View contains numeric measures and totals rather than currency symbols and display separators. Check the saved output when another tool will consume the values.
Agents and saved outputs
Agents and external AI tools connected through MCP can configure Pivot and save results when they have access to the source, Pivot and destination. Each save creates a new View. Ask them to inspect the saved rows as well as the preview when checking a complete result.
Examples
Use the six order records below. Their total is 28 units.
region,month,units
North,April,8
North,April,3
South,April,5
South,May,2
North,May,4
South,May,6
Units by region and month
Put region in Rows, month in Columns and units in Values. Change Summarize by to Sum to produce the result below. Keeping Count would show North/April as 2 contributing records.
- North - April: 11. May: 4. Grand Total: 15.
- South - April: 5. May: 8. Grand Total: 13.
- Grand Total - April: 16. May: 12. Grand Total: 28.
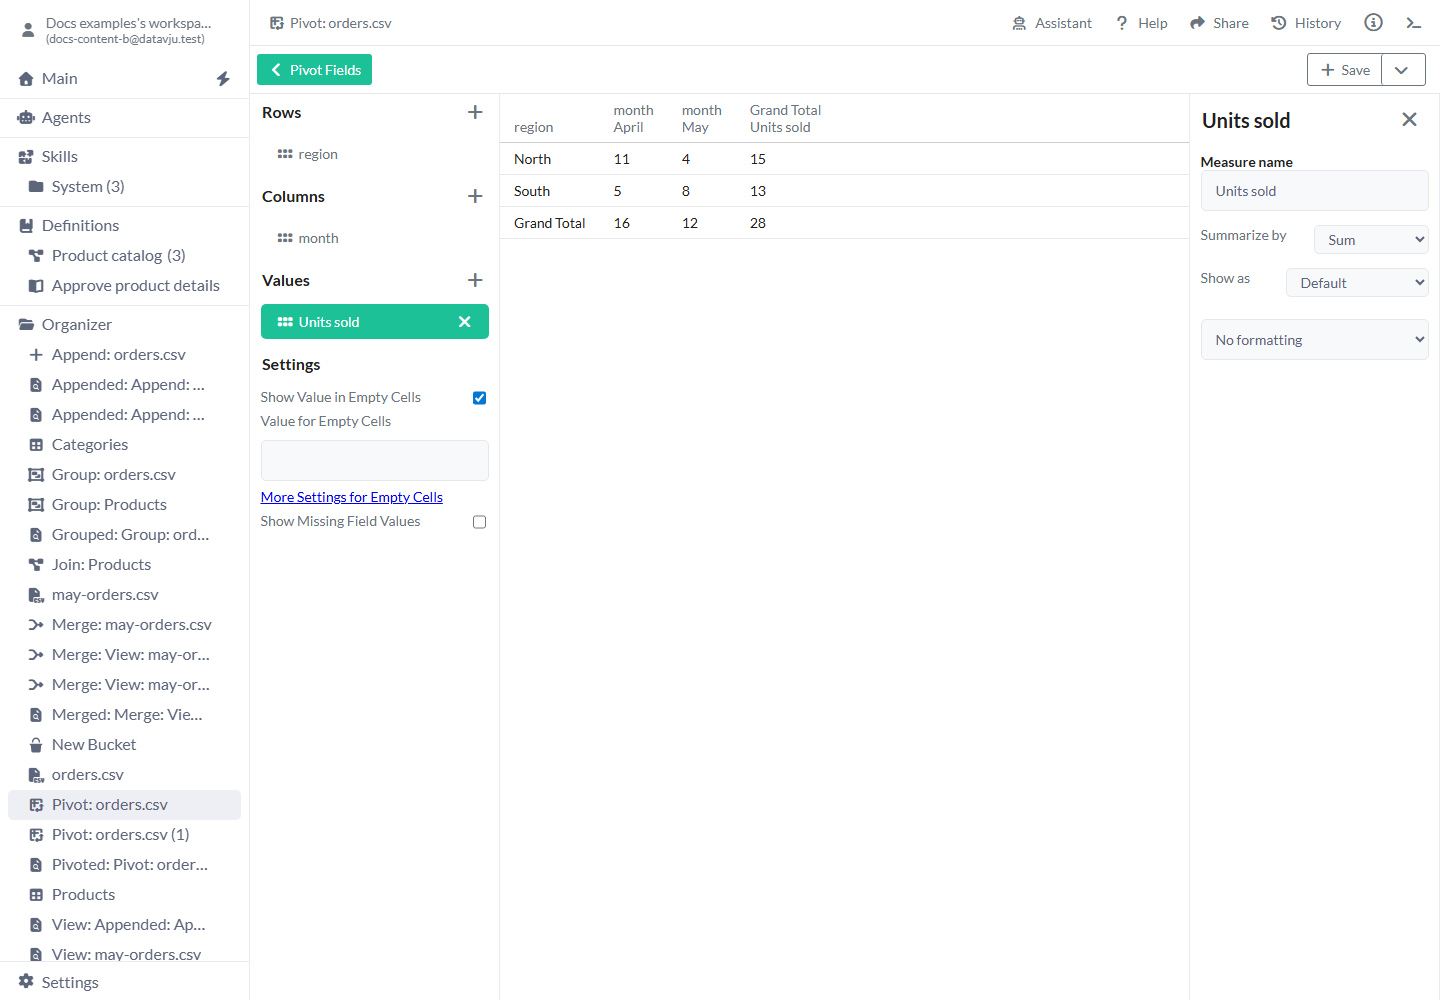
Rows and Columns split the Sum into a regional and monthly summary.
Compare each region's monthly mix
Use the same Pivot and set Show as → % of Row, then Measure format → Percentage with two decimals. North shows April 73.33%, May 26.67%, total 100.00%. South shows April 38.46%, May 61.54%, total 100.00%. Each region's own units supply its denominator.
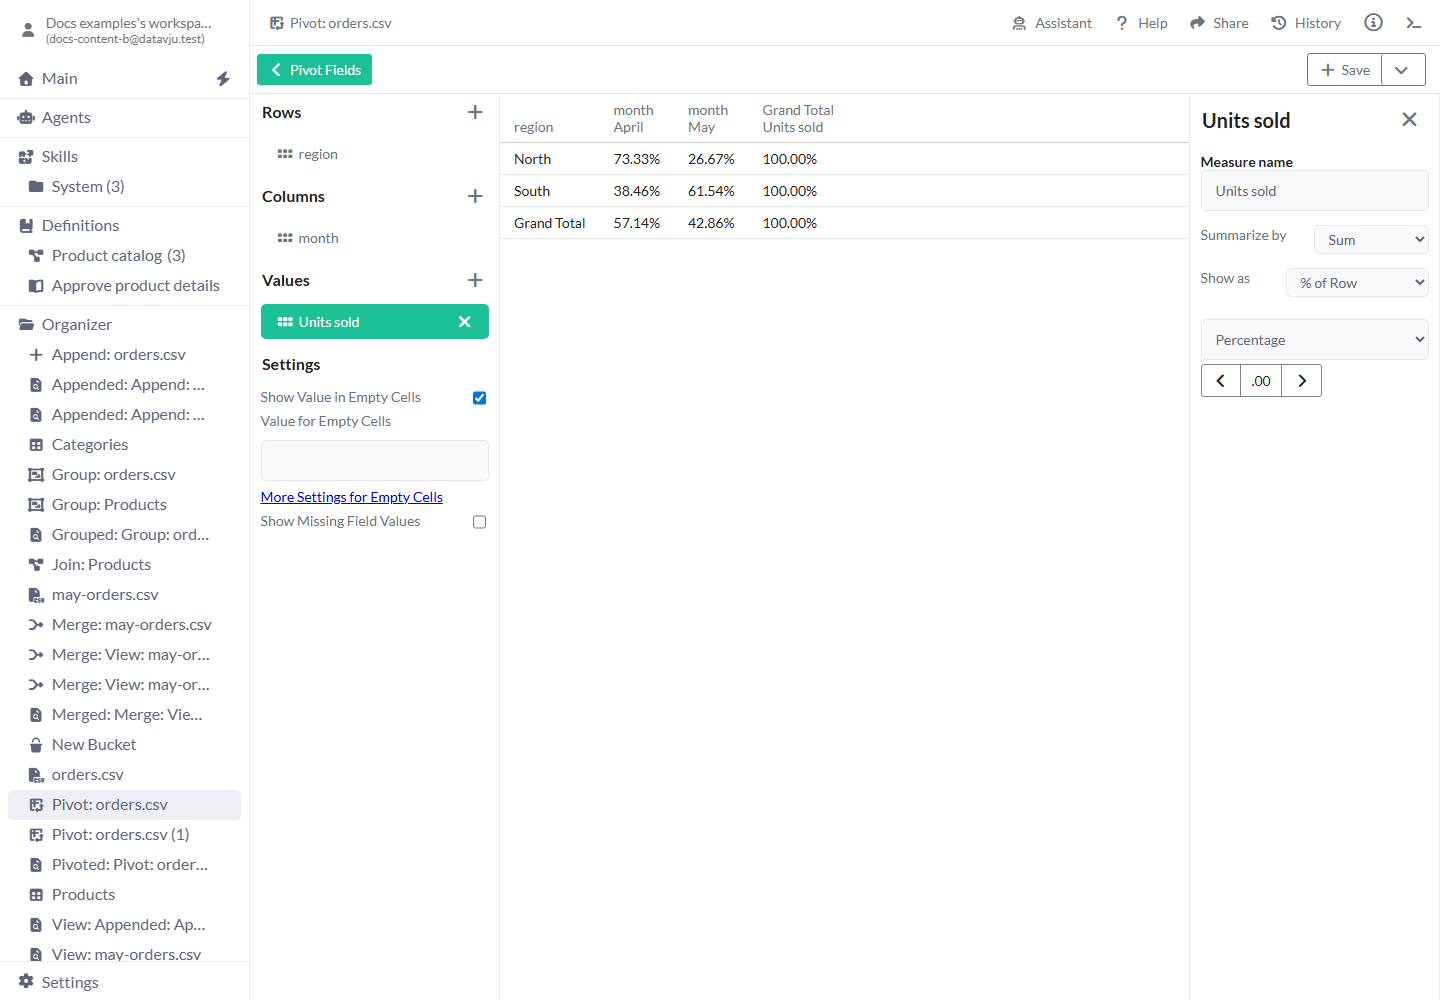
Use a percentage of row when each region should total 100 percent.
Decide whether a missing reading is zero
A Number field contains readings 10, null and 30 for North. Add region to Rows and Average(reading) to Values. With empty-cell replacement off, the result is 20: only the two present readings contribute.
Enable Show Value in Empty Cells and set Value for Empty Cells to 0. The result becomes 13.333333333333334 because all three readings now contribute. Keep replacement off when missing means unknown. Use 0 only when treating the missing reading as zero is the intended calculation.
Limits and common mistakes
Choose the row layout and calculation deliberately before comparing totals.
- New value fields default to Count. Numeric input alone does not choose Sum.
- A percentage needs the intended denominator. % of Row, % of Column and % of Grand Total answer different questions.
- Formatting changes presentation, not source data or currency conversion.
- Missing values are not evidence of zero activity. Numeric empty-cell replacement can change aggregation; inspect its effect on null inputs.
- With multiple row fields, ungrouped Narrow creates a separate summary for each field. Its grand total counts the same input in each field's summary; use Grouped or Wide when you need totals for joint combinations.
- A saved View captures its recipe at save time. Later Pivot edits require another save if the result should use them.
- Source dimension values determine dynamic output columns. Inspect the result after source changes before relying on particular column labels downstream.