Pivot
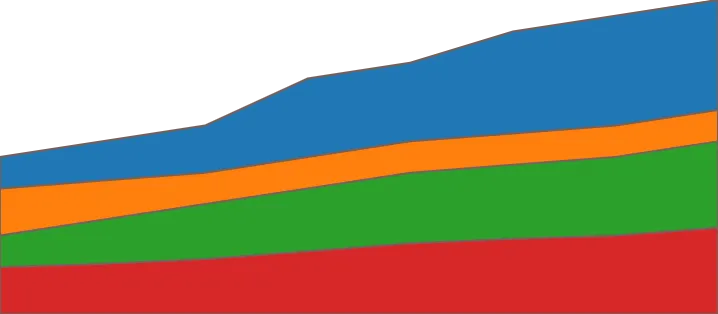
Fill the space between lines or along axes to emphasize volume or quantity over time or categories.

Pivot Fields
Click on the root Viz node, then explore and find "Areas" in the list. Then click on it to add to the canvas.
Rows
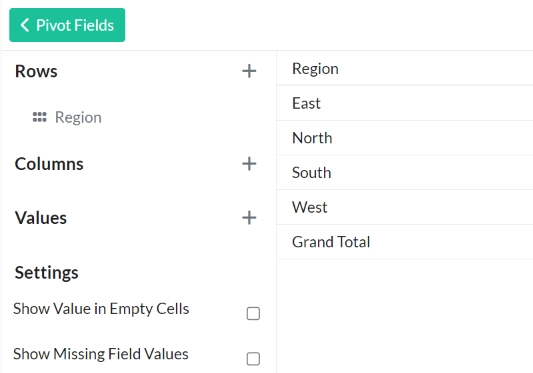
The "Rows" section is where you add fields that you want to use as categories or dimensions in your data. The fields you place here will determine the vertical layout of your pivot table, organizing the data into distinct rows based on the values in those fields.
Steps
- In the "Pivot Fields" panel click on the plus button next to "Rows".
- In the list of columns from your dataset click on a column that categorize your data.
- Verify that the values of your selected columns is listed in the table.
Example

Columns
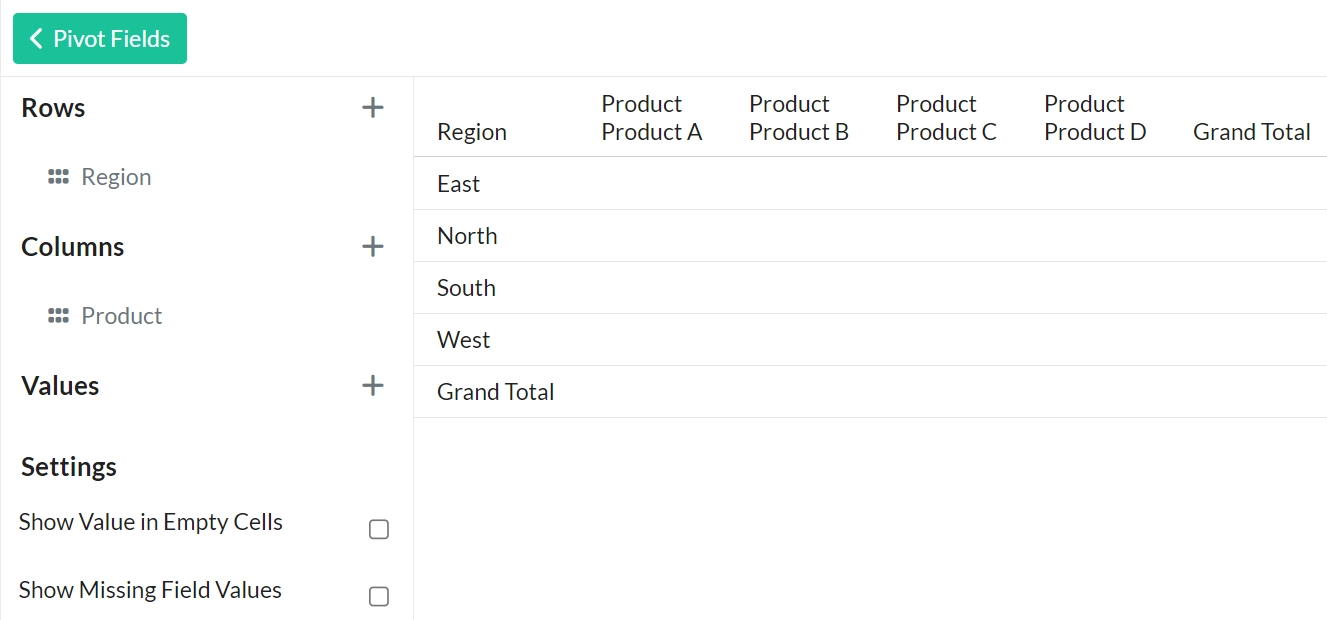
The "Columns" section in a pivot table is where you add fields that you want to use to categorize your data horizontally. The fields you place here will determine the horizontal layout of your pivot table, organizing the data into distinct columns based on the values in those fields.
Steps
- In the "Pivot Fields" panel click on the plus button next to "Columns".
- In the list of columns from your dataset click on a column that categorize your data.
- Verify that the values of your selected columns is listed in the table.
Example

Values
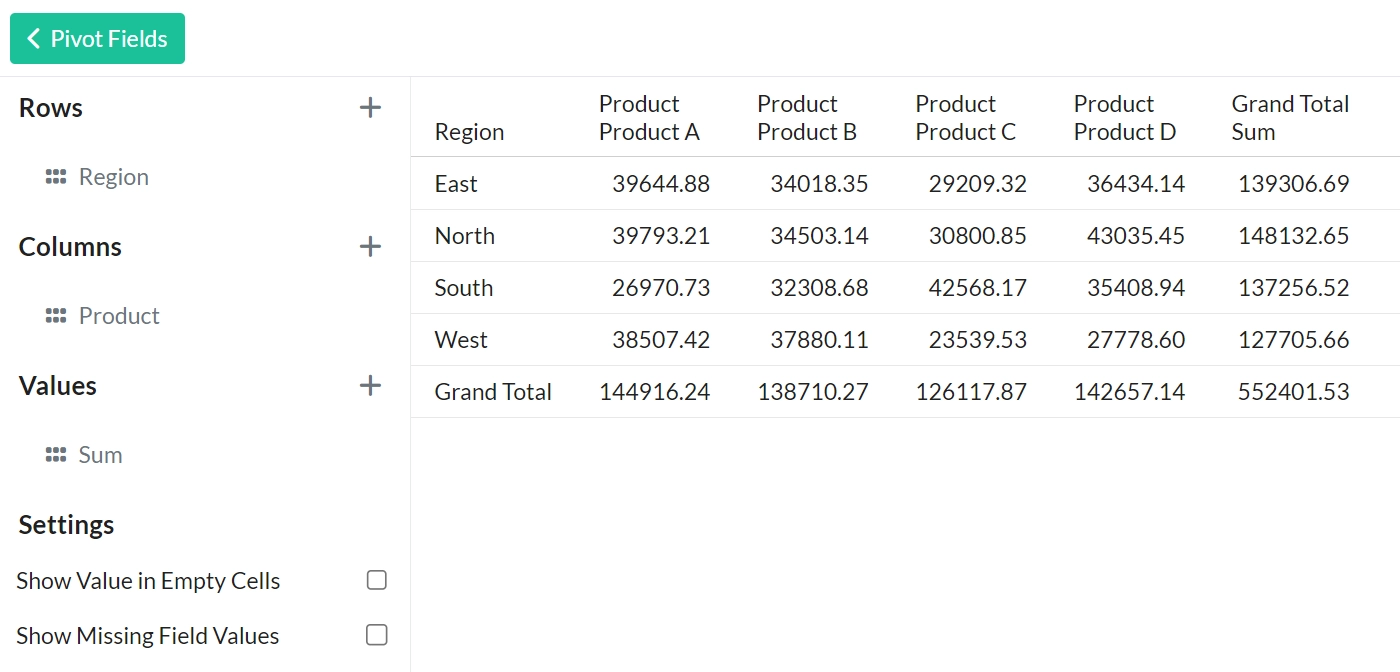
The "Values" section in a pivot table is where you add fields that contain numerical data you want to analyze. These fields will be used to perform calculations such as sums, averages, counts, or other aggregations, which populate the body of the pivot table.
Steps
- In the "Pivot Fields" panel click on the plus button next to "Columns".
- In the list of columns from your dataset click on a column that categorize your data.
- Verify that the values of your selected columns is listed in the table.
Example

Scale Type
Choose the type of scaling for the chart\'s axes, such as linear, logarithmic, or time-based, to best fit the nature of the data.
Pivot Fields
Click on the root Viz node, then explore and find "Areas" in the list. Then click on it to add to the canvas.