Viz
Fill the space between lines or along axes to emphasize volume or quantity over time or categories.
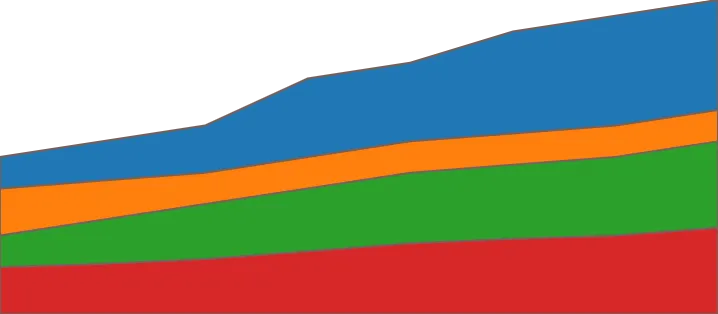
Add Areas
Click on the root Viz node, then explore and find "Areas" in the list. Then click on it to add to the canvas.
Columns
Select which data columns should be represented in the area chart, defining the dimensions and data points for visualization.
Min
Set the minimum value for the scale of the area chart, establishing the lower bound of the data range displayed.
Max
Define the maximum value for the scale of the area chart, establishing the upper bound of the data range displayed.
Scale Type
Choose the type of scaling for the chart\'s axes, such as linear, logarithmic, or time-based, to best fit the nature of the data.