
Correlation
Correlation compares number columns from a Table or saved View and shows their relationships in a grid. Use it to explore whether measurements move together, such as visits and sign-ups. Choose the columns and calculation, inspect the result, then save a View if you want to use it in other tools.
Create an analysis
Compare two columns from the same observations, such as Visits and Sign-ups recorded each week.
- Open the source Table or saved View.
- Open Output options beside New and choose Correlation.
- In Variables, turn on the numeric columns to compare.
- Leave Correlation Function at Correlation Coefficient for a first comparison.
- Read the updated table. Changing a variable or function reruns the calculation; there is no separate Generate step.
- Choose Save to create a reusable View of the result.
Settings
The result updates automatically when you change the function or selected number columns.
Correlation Function
Covariance depends on the units of the original measurements and can be larger than 1. Use a correlation coefficient when you need a result on a scale from −1 to 1.
- Correlation Coefficient - Meaning: The default; Pearson correlation measures linear association, from −1 to 1 when defined. When to use it: Compare numeric measurements whose straight-line relationship matters. Example: Twice as many visits with twice as many sign-ups gives a positive coefficient.
- Kendall's Rank Correlation - Meaning: Compares agreement in the ordering of observations. When to use it: Examine whether higher values tend to accompany higher ranks. Example: Compare two scoring systems' ordering of the same items.
- Population Covariance - Meaning: Measures how two quantities vary together by dividing by the number of paired observations. Its scale depends on the original units. When to use it: Treat the rows as the whole population being described. Example: Describe joint movement across every store in your current network.
- Sample Coefficient - Meaning: Sample covariance divides by one less than the number of paired observations. When to use it: Estimate covariance from a sample of observations. Example: Analyze a sampled set of stores.
- Spearman's Rank Correlation - Meaning: Compares ranked values rather than their raw magnitudes. When to use it: Explore measurements that keep rising or falling together even when their pattern is not a straight line. Example: Compare study time with an assessment ranking.
Variables and ordering
Variables in the toolbar hides or shows the settings panel; drag its divider to resize it. Variables start unselected. In Variables, you see the names and types of your columns. Turn on the number columns you want to compare. Turn a variable on to include it and off to remove it. Drag its handle, labelled Drag to reorder, to change the comparison order.
Until you choose a variable, you may see your original data. Turn on at least two number columns to compare them in the result grid.
Save options
Save an output when another tool needs to read the matrix, rather than the original measurements.
- Save and Save as View create an output alongside the analysis. The proposed name starts with
Correlated:followed by the analysis name. - Save as View to... opens destination selection when the result belongs in another folder.
- Select variables to enable Save. You get a separate result View and keep the original measurements available.
Examples
Compare a positive relationship, a negative relationship and two covariance calculations using three observations.
Use these sample rows for the three examples.
Week,Visits,Sign-ups,Waiting minutes,Satisfaction
A,1,2,1,9
B,2,4,2,6
C,3,6,3,3
Check a perfectly linear relationship
Use Visits and Sign-ups from the example data above.
Read the cross-column value for the relationship between Visits and Sign-ups. Values on the diagonal compare each column with itself.
- Create Correlation from that Table.
- Select Visits and Sign-ups.
- Keep Correlation Coefficient.
- Read the cell at the Visits row and Sign-ups column: this dataset has a coefficient of
1because Sign-ups is exactly twice Visits.
Distinguish a negative relationship
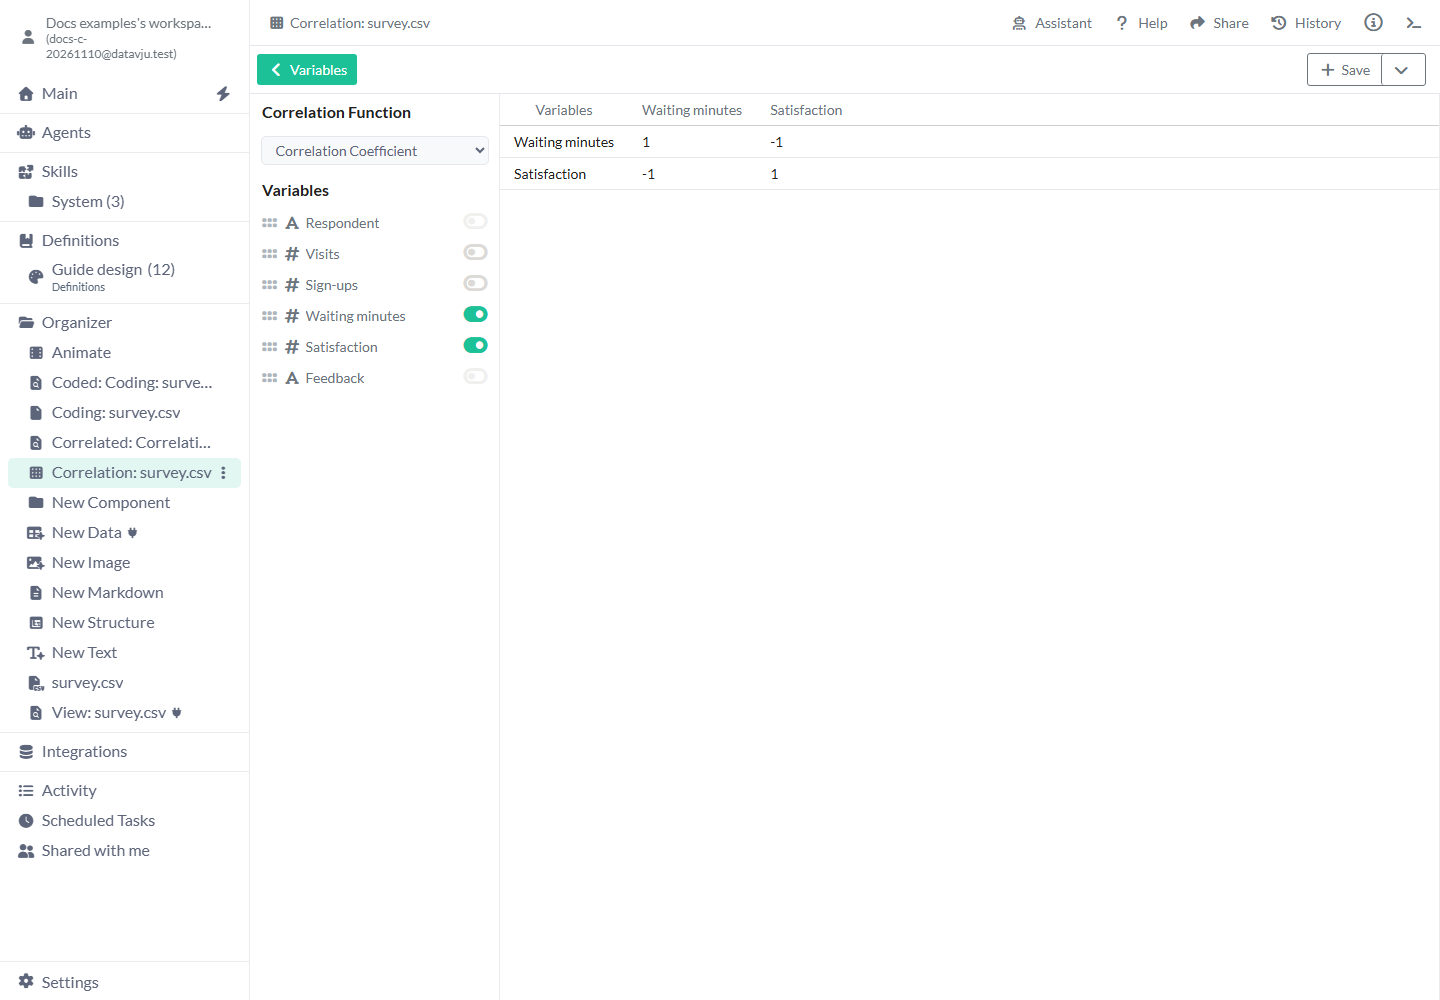
Use numeric Waiting minutes values 1, 2, 3 and Satisfaction values 9, 6, 3 across three observations.
A negative sign means one measurement falls as the other rises. Investigate other factors before deciding what causes the relationship.
- Select both columns under Variables.
- Choose Correlation Coefficient.
- Read the cross-column result of
−1: satisfaction falls linearly as waiting increases in this example. - Open a Viz of the original observations to inspect their shape before drawing conclusions.
Compare population and sample covariance
Reuse the Visits and Sign-ups data from the first example.
Record the function you used when sharing an analysis: these calculations give different results for the same observations.
- Choose Population Covariance. The cross-column covariance is
4/3, approximately1.3333. - Choose Sample Coefficient. Sample covariance is
2for those same three pairs. - Return to Correlation Coefficient to see the scale-independent value
1.
Assistant and Help
Assistant opens a conversation for the current analysis. Enter a request in Describe a command for this correlation... and choose Submit; Reset Chat starts a fresh conversation. You can also ask Main or a User Agent with access to your data to save a table result as Correlation. Open that item and choose the columns you want to compare. The Help button currently opens generic Datavju help for this tool.
Limits and common mistakes
- Only numeric columns can be enabled. A column containing digits as Text needs an appropriate numeric type before analysis.
- Constant columns, too few observations and missing values can produce undefined values or a failed query. Prepare the numeric inputs first; do not assume every function removes missing pairs in the same way. Check empty results before interpreting the relationship.
- Rank methods and covariance answer different questions from Pearson correlation. Check the chosen function before interpreting a number.
- Small, duplicated or unrepresentative observations can produce misleading results. Investigate other factors before deciding what caused the pattern.
- The label Sample Coefficient currently means sample covariance; choose it when you need sample covariance.
- A saved result is separate from the source records. Refresh the saved View to recompute its saved calculation from current source rows. Later edits to the analysis item do not rewrite that View’s saved calculation.